Data is collected by the provost marshal's office and includes complaints and calls-for-service. Then
analyze this data to give you the locations and times of incidents and other information.
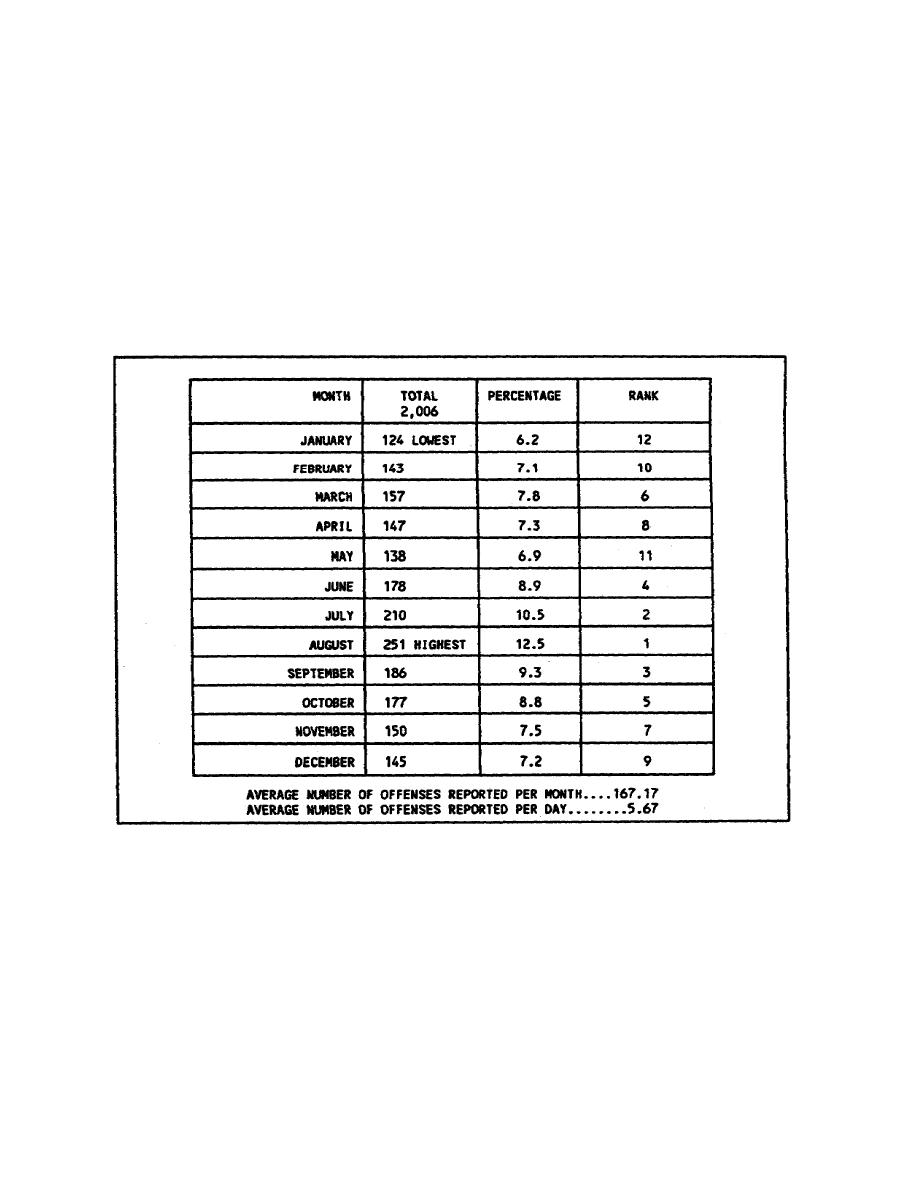
The chart in Figure 1-1 shows a basic method for organizing summary data.
The chart in Figure 1-1 represents the total number of complaints received per month for a period of
one year. Note the change in complaint levels from month to month. August shows a high of 251
whereas January shows only 124 incidents. The monthly average is 167.17 which is determined by
dividing the yearly total of offenses by 12. You might make a conservative prediction that the next
January offenses would be in the 124-251 range. However, you must take into consideration any
changes in the total picture that might affect the rate of offenses. For example, unit transfers or
increased troop strengths would probably cause changes in the rate of offenses.
Figure 1-1. Annual Complaint Summary by Month.
(2) The next step is to determine how the offenses varied by day of the week and hour of the
day. A 7-day, 24-hour week is used in developing the chart in Figure 1-2.
From the top of the chart we see that a large percentage of crimes occur on Friday and Saturday. The
pattern shows a low on Sunday of 10 percent and a
MP2000
1-4


 Previous Page
