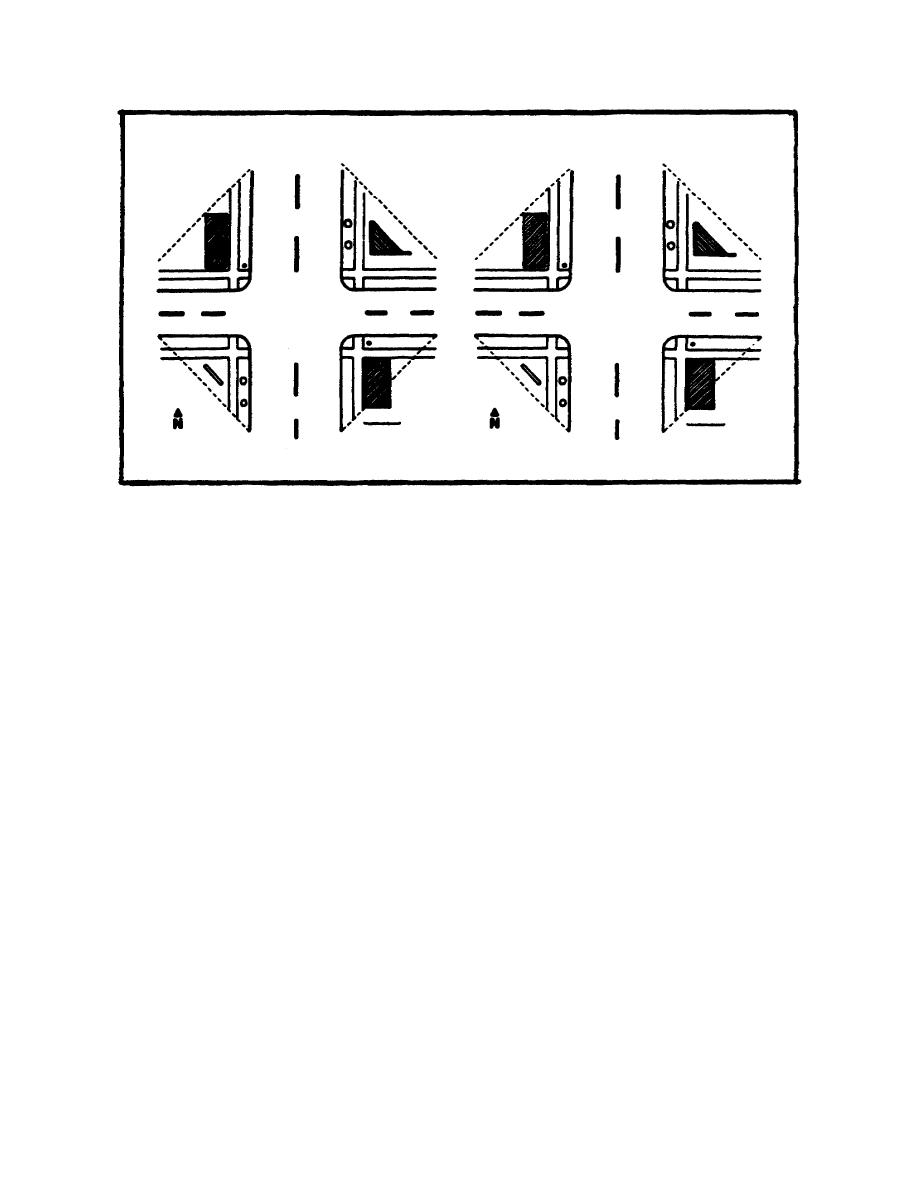
Figure 2-4. Condition Diagram.
A condition diagram is a scale drawing which provides a picture of the physical conditions present at
the location under study. From this diagram you can determine--
o The required visibility distance for the 85th percentile speed on the road.
o The actual visibility triangle.
NOTE: The 85th percentile is the speed at and above which 15 percent of the vehicles passing a
location were traveling. This is determined by a speed study of the location.
A rough sketch of the location should be made at the scene and later transferred to an 8.5 x 11 inch
sheet of paper.
A scale of 30 to 40 feet per inch should be used. Observations and measurements should include--
o
Curbs.
o
Roadway limits.
o
Property lines.
o
Sidewalks.
o
Driveways.
2-11
MP2000


 Previous Page
