LESSON 2/TASK 1
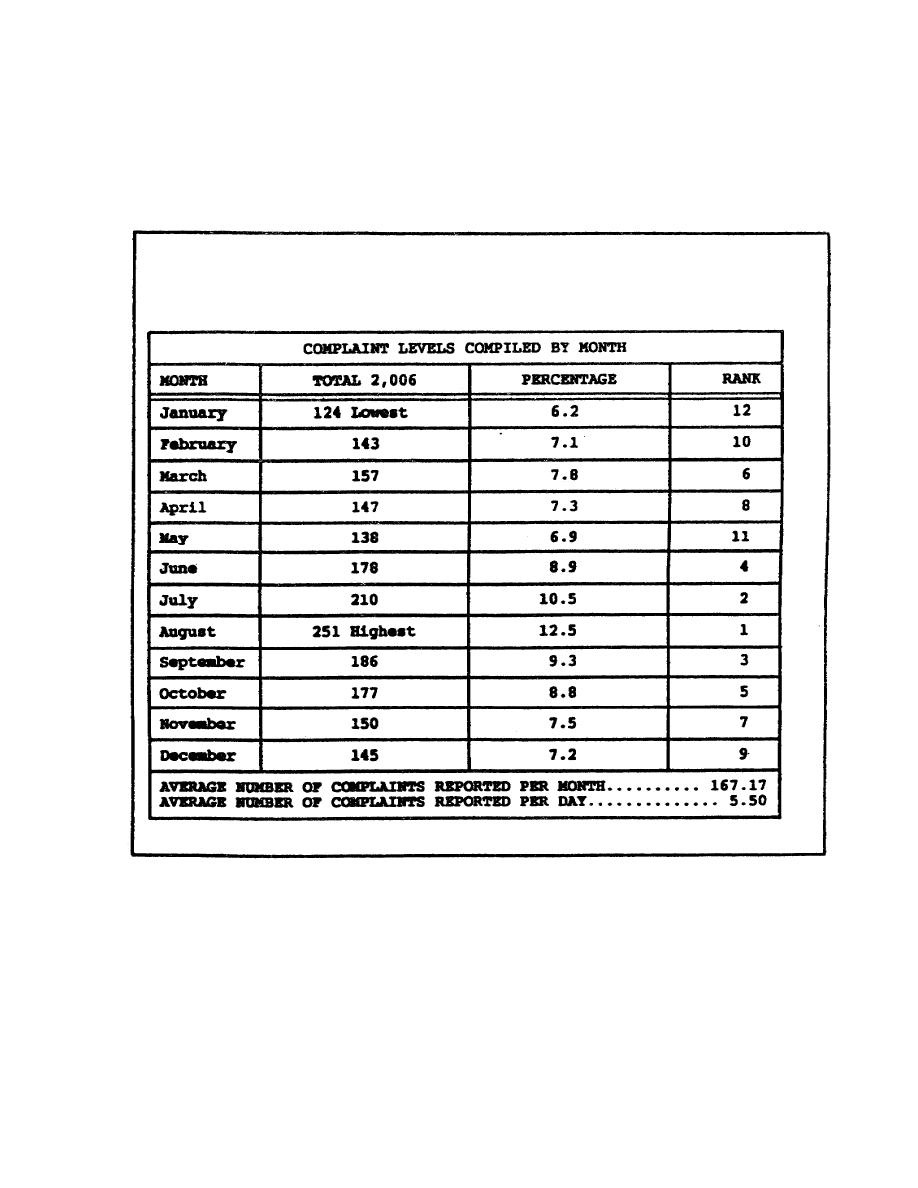
Figure 4 is an illustration of a display of this preliminary data. It summarizes complaints received over a
twelve month period. An examination of the chart tells you when patrols are likeliest to be most busy.
The Army Training and Evaluation Program (ARTEP) or SQT might be scheduled during the period that
has the fewest complaints.
FIGURE 4. COMPLAINT LEVELS COMPILED BY MONTH.
In the example, the complaints range from a high of 251 in August to a low of 124 in January. The
monthly average of offenses is 167.17. For the following January, a conservative prediction would be
that the number of offenses would fall in the 124-251 offense range. This information must also be
examined in the light of historical data over a period of several years for January. Caution must also be
exercised in such predictions to take into account any changes that might affect the number of offenses
for the
35


 Previous Page
